

Here’s a (maybe) mildly spicy hot take: Email marketing reporting is the backbone of any performance-focused email strategy. Without it, you’re sending campaigns into a void, unable to see what’s working, what’s falling flat, and most importantly, what’s driving revenue.

The top reporting features in email marketing software go far beyond open rates and click-throughs. Today’s email reporting tools enable closed-loop reporting, connecting every email touchpoint to pipeline outcomes and customer lifetime value. This means marketers can finally answer the question executives care about most: How does email contribute to revenue?
In this guide, I’ll break down what email marketing reporting actually involves — which KPIs to track at each funnel stage, how to build a dashboard that surfaces actionable insights, and which email marketing reporting tools can help you get there.
Let’s get started.
Table of Contents
What is email marketing reporting?
Email marketing reporting is the process of collecting, analyzing, and interpreting data from your email campaigns to measure performance and inform strategy. It transforms raw metrics, such as:
These data points yield actionable insights that directly connect to pipeline growth, revenue generation, and customer lifetime value.
Moreover, robust email marketing reporting answers three core questions:
- Are your emails reaching inboxes?
- Are recipients engaging with your content?
- (Most critically) Are those engagements driving measurable business outcomes?
Now, comprehensive email marketing reporting requires the following:
- Tracking deliverability metrics
- Engagement rates
- Revenue attribution
This means monitoring not just surface-level activity, but understanding how each email touchpoint contributes to a contact’s journey from subscriber to customer.
Additionally, the top reporting features in email marketing software include:

- Deliverability tracking: This feature monitors inbox placement, bounce rates, and sender reputation
- Engagement analytics: These metrics cover open rates, click-through rates, click mapping, and unsubscribe trends
- Revenue attribution: These metrics connect email interactions to closed deals and pipeline value
- Audience segmentation insights: This capability reveals which contact groups respond to specific content types
- A/B test results: This data quantifies performance differences between subject lines, send times, and content variations
All-in-all, without robust email marketing reporting tools, you’re essentially sending campaigns into a void. With them, every email becomes a data point that sharpens your understanding of what drives revenue.
Now that we’ve covered what email marketing reporting is and why it matters, in the next section, let’s talk specifics: what metrics you’ll track to measure campaign success and prove business impact.
Pro Tip: HubSpot’s Reporting and Dashboard Software connects email touchpoints to revenue outcomes, multi-touch attribution models, and full-funnel visibility — allowing marketers to see exactly how email contributes to CLV over time.
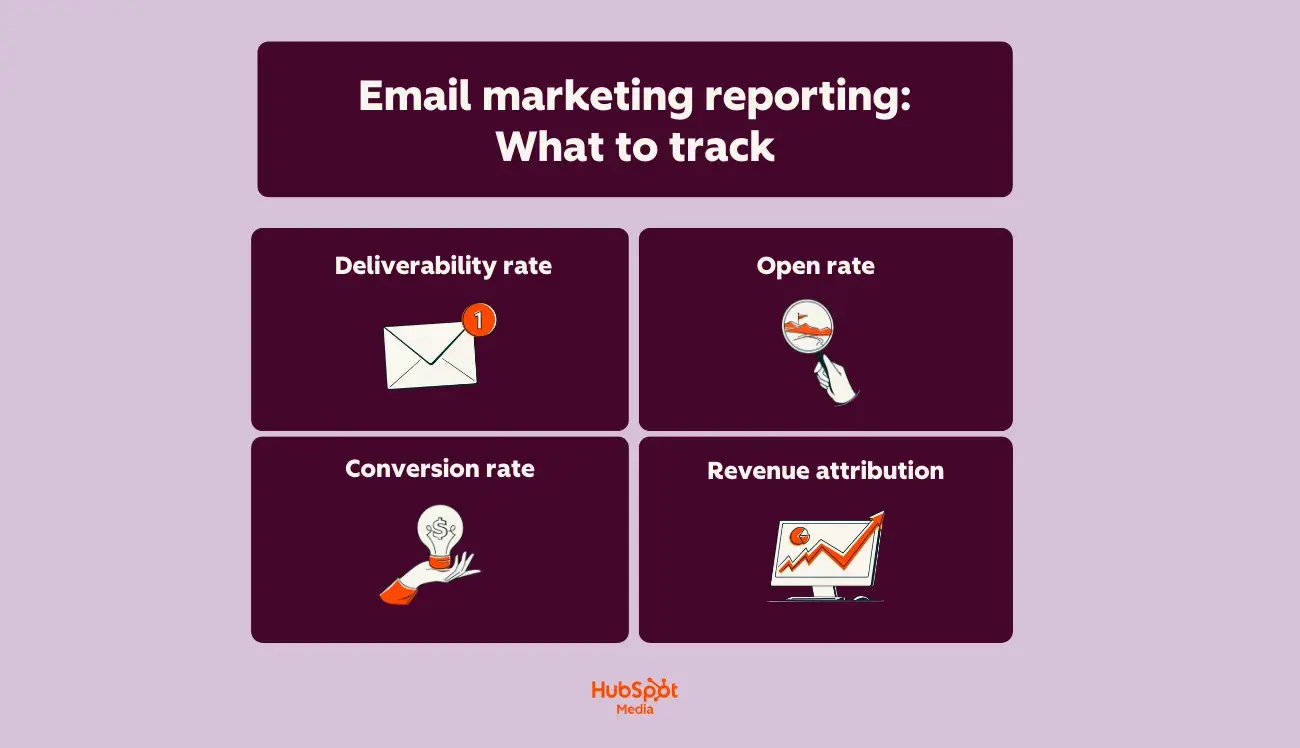
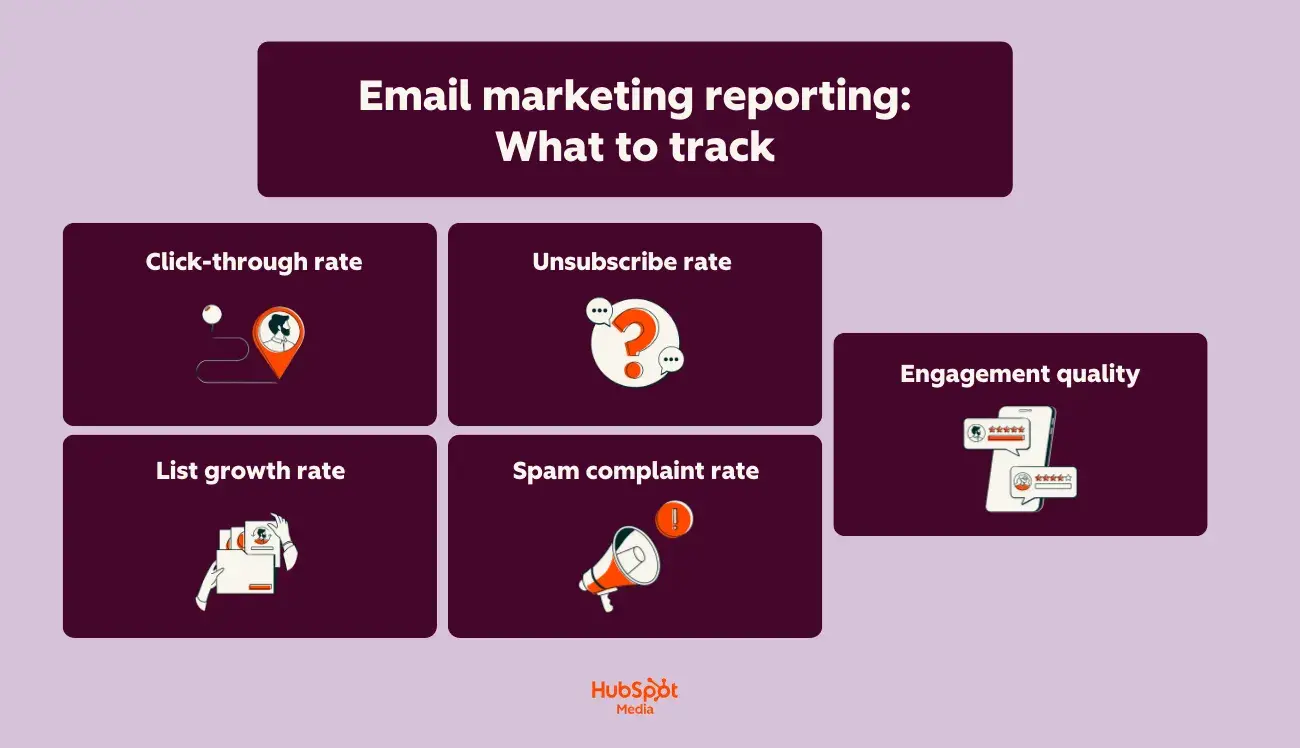
Email marketing reporting: What to track
Now that we’ve covered what email marketing reporting is, let’s talk about how you’ll put it into practice.
As previously mentioned, email marketing reporting requires:
- Tracking deliverability metrics
- Engagement rates
- Revenue attribution
However, the detailed breakdown below provides complete visibility into campaign health and business impact.
To build a complete email reporting framework, take a look at the following nine metrics:
- Deliverability rate: This foundational metric measures the percentage of emails that successfully reach subscribers’ inboxes. (A deliverability rate below 95% signals list hygiene or authentication issues that require immediate attention.)
- Open rate: This engagement indicator indicates how many recipients viewed your email. Open rates provide directional insight into subject line effectiveness and send time optimization.
- Click-through rate (CTR): This engagement indicator reveals the percentage of recipients who clicked at least one link. This metric directly measures content relevance and CTA effectiveness. Most email reporting tools (like HubSpot’s Email Marketing Software) show click mapping to identify which specific links drive engagement.
- Conversion rate: This action-based metric tracks recipients who complete a desired action, such as submitting a form, making a purchase, downloading, or requesting a demo. Well-executed email marketing reporting combines real-time performance data, audience segmentation insights, and conversion tracking to accurately attribute these actions.
- Revenue attribution: This bottom-line metric connects email touches to closed deals. The top reporting features in email marketing software include first-touch attribution, multi-touch models, pipeline influence reporting, and customer lifetime value.
- List growth rate: This health indicator measures net subscriber acquisition after accounting for unsubscribes and bounces. To calculate your list growth rate, calculate monthly: (new subscribers − lost subscribers) ÷ total list size × 100. (Healthy lists grow 2-5% monthly.)
- Unsubscribe rate: This retention metric measures the percentage of recipients who unsubscribe from your emails after a campaign send. Sudden spikes indicate content-audience misalignment, over-sending, or poor list segmentation.
- Spam complaint rate: This measures how often recipients mark your emails as spam. This rate must stay below 0.1% to protect the sender’s reputation. Email marketing reporting tools should flag campaigns exceeding this threshold immediately.
- Engagement quality: This advanced metric goes beyond opens and clicks to measure meaningful interaction. It encompasses time spent reading emails, forwarding and sharing rates, reply rates for conversational campaigns, and repeat engagement from the same contacts.
Next, let’s walk through how to build an email reporting dashboard — all with these metrics as your foundation.
Pro Tip: HubSpot’s Marketing Hub provides comprehensive email reporting dashboards, A/B testing analytics, and contact-level engagement tracking, so you can monitor the KPIs mentioned above from a single platform connected to your CRM data.
How to build an email reporting dashboard the right way
A well-built email reporting dashboard turns scattered data into clear, actionable insights. What’s even more, advanced email reporting platforms offer:
- Native CRM integration
- Custom dashboard creation
- Cross-channel attribution capabilities
But only if you set them up strategically from the start. Here’s how to build yours the right way — check out the following steps:
Step #1: Define your reporting goals before adding a single widget.
Your dashboard should answer specific business questions, not just display every available metric. Start by identifying what decisions your email reporting will inform.
Ask yourself:
- Are you optimizing for engagement, conversions, or revenue?
- Who will use this dashboard — marketing managers, executives, or campaign specialists?
- What timeframes matter most: daily performance, weekly trends, or monthly benchmarks?
Step #2: Select KPIs that align with your funnel stage.
Not every metric belongs on every dashboard. Match your KPIs to what you’re actually trying to measure.
Here’s how you’ll assess email marketing reporting based on your funnel stage:
- Top-of-funnel campaigns (newsletters, nurture sequences): Prioritize open rates, click-through rates, and list growth
- Mid-funnel campaigns (product education, case studies): Focus on conversion rates, content engagement depth, and lead scoring changes
- Bottom-of-funnel campaigns (sales enablement, demos): Track revenue attribution, pipeline influence, and deal velocity
Pro Tip: HubSpot’s Reporting and Dashboard Software connects email touchpoints to revenue outcomes, multi-touch attribution models, and full-funnel visibility — making it easy to see how each campaign type contributes to closed deals.
Step #3: Build your dashboard structure with hierarchy in mind.
The top reporting features in email marketing software mean nothing if your dashboard layout creates confusion. Organize information from high-level insights down to granular details.
Here’s a structure I recommend:
- Row 1: Executive summary – total sends, overall engagement rate, revenue attributed to email this period
- Row 2: Deliverability health — inbox placement, bounce rates, spam complaints
- Row 3: Engagement performance — opens, clicks, and conversions by campaign type
- Row 4: List and audience metrics — growth rate, segment performance, unsubscribe trends
Step #4: Connect email data to your CRM and revenue sources.
Time for a marketing reality check (that you didn’t ask for): Email reporting in isolation only tells half the story.
Effective email analytics combines:
- Real-time performance data
- Audience segmentation insights
- Conversion tracking
However, all of this requires connecting your email platform to contact records and deal data.
With HubSpot’s Marketing Hub, your email reporting dashboard automatically pulls from your CRM. This means you can see which emails influenced specific deals, track engagement by lifecycle stage, and measure true customer lifetime value by acquisition source.
Step #5: Set up automated alerts and benchmarks.
Don’t wait until your weekly review to catch problems. Email marketing reporting tools should notify you when metrics fall outside acceptable ranges.
Therefore, configure alerts for:
- Deliverability dropping below 95%
- Spam complaint rates exceeding 0.1%
- Spikes in unsubscribe rates
- Conversion rates falling below your rolling average
Step #6: Schedule regular reviews and iterate.
Your dashboard isn’t a set-it-and-forget-it tool. Schedule weekly check-ins to review performance and monthly deep-dives to assess whether your tracked metrics still align with business goals.
During each review, be sure to:
- Identify top-performing campaigns and analyze what made them work
- Flag underperforming segments for testing or suppression
- Update benchmarks based on recent performance trends
- Add or remove widgets as your email strategy evolves
Building your email marketing reporting dashboard correctly from the start saves hours of rework later. Plus, with HubSpot’s connected reporting ecosystem, every email sent becomes a data point that ties directly to the pipeline and revenue.
Pro Tip: HubSpot’s Breeze AI enhances email reporting with predictive send-time optimization, automated performance summaries, and actionable recommendations — helping you spot patterns and opportunities more quickly during these reviews.
Templates for email marketing reporting
Consistent reporting keeps stakeholders informed and helps you spot trends before they become problems. These three templates give you ready-to-use formats for different audiences and cadences — so you spend less time building reports and more time acting on insights.
As previously mentioned, email marketing reporting requires tracking deliverability metrics, engagement rates, and revenue attribution. Moreover, the templates I’ve provided below organize these data points into clear, stakeholder-friendly formats.
Take a look:
Template #1: Weekly Email Pulse Check
Best for: Marketing team syncs, campaign managers, quick performance snapshots.
Here’s the table you’ll use:
Metric | This Week | Last Week | % Change |
Emails sent | |||
Deliverability rate | |||
Open rate | |||
Click-through rate | |||
Conversion rate | |||
Unsubscribe rate |
Then, be sure to add context with qualitative notes, including:
- Top-performing email: [Campaign name] — [Key metric that stood out]
- Areas of concern: [Any metrics trending downward or below benchmark]
- Next week’s focus: [One or two priorities based on this week’s data]
Overall, this template works well for email reporting during standing team meetings. Its format is scannable, consistent, and action-oriented.
Pro Tip: If you’re using HubSpot’s Marketing Hub, you’ll be able to grab email reporting dashboard data, A/B testing analytics, and contact-level engagement tracking all in one place, making it easy to pull these numbers in minutes.
Template 2: Monthly Executive Summary
Best for: Leadership updates, cross-functional stakeholders, budget discussions.
Volume & Reach:
- Total emails sent: [Number]
- Average deliverability rate: [%]
- List size (end of month): [Number]
- Net list growth: [+/- Number] ([%] change)
Engagement Summary:
- Average open rate: [%] (benchmark: [%])
- Average CTR: [%] (benchmark: [%])
- Total clicks: [Number]
Business Impact:
- Conversions attributed to email: [Number]
- Revenue attributed to email: [$]
- Pipeline influenced by email: [$]
- Top-converting campaign: [Name]
Key Insights:
- [Insight about what worked]
- [Insight about audience behavior]
- [Recommendation for next month]
This template is easy to copy and paste, making it simple to customize and share when necessary.
Template #3: Campaign Post-Send Report
Best for: Individual campaign analysis, A/B test documentation, stakeholder recaps.
First, include the following information:
- Campaign Name: [Name]
- Send Date: [Date]
- Audience Segment: [Segment name and size]
- Campaign Goal: [Primary objective]
Then, dive into the nitty-gritty elements of your email marketing campaign:
Deliverability:
- Sent: [Number]
- Delivered: [Number] ([%])
- Bounced: [Number] (Hard: [#] / Soft: [#])
Engagement:
- Opens: [Number] ([%])
- Unique clicks: [Number] ([%])
- Click-to-open rate: [%]
- Top clicked link: [URL or CTA description]
Conversions & Attribution:
- Primary conversion action: [Description]
- Conversions: [Number]
- Conversion rate: [%]
- Revenue attributed: [$]
A/B Test Results (if applicable):
- Variable tested: [Subject line / Send time / CTA / etc.]
- Variant A: [Result]
- Variant B: [Result]
- Winner: [A or B] — [Why]
Takeaways:
- What worked: [Specific element]
- What to test next: [Hypothesis]
Ultimately, these templates are meant to serve as starting points for your team’s email reporting workflow. Feel free to edit them based on your specific KPIs and stakeholder needs.
Email marketing reporting tools (at a glance)
Tool | Best For | Key Features | Pricing | Free Trial |
B2B teams needing email reporting connected to the sales pipeline and revenue attribution | Native CRM integration Multi-touch attribution reporting Custom dashboard builder Click mapping List health monitoring Breeze AI for predictive optimization | Starter: $9/month Professional: $800/month Enterprise: $3,600/month | Yes, 14 days | |
E-commerce brands needing direct revenue attribution tied to product catalog data | Revenue-per-recipient tracking Predictive analytics (CLV, churn risk) Segment performance comparison Product-level attribution Benchmark data | Free: $0/month Email (1,001 to 1,500 profiles): $45/month Email (1,501 to 2,500 profiles): $65/month *Note: Pricing for Klaviyo is based on the number of active profiles. | No (free tier available) | |
Small to mid-sized businesses seeking user-friendly email reporting | Campaign performance snapshots Comparative reporting Click maps Industry benchmark comparisons AI-driven content optimizer | Free: $0/month Essentials: $13/month Standard: $20/month Premium: $350/month *Note: Pricing for Mailchimp is based on the number of contacts. | Yes, 14 days | |
Enterprise organizations invested in Salesforce needing unified sales and service data | Einstein AI analytics Cross-channel journey reporting Custom SQL report builder Deliverability monitoring Account-based reporting | Salesforce Starter: $25/month Marketing Cloud Growth Edition: $1,500/month Marketing Cloud Advanced Edition: $3,250/month | No | |
Teams running sophisticated automation workflows requiring sequence-level performance visibility | Automation funnel reporting Site tracking integration Deal attribution Split testing reports Engagement tagging | Starter: $15/month Plus: $49/month Pro: $79/month Enterprise: $145/month | Yes, 14 days | |
Teams prioritizing email design optimization, accessibility compliance, and engagement quality analysis | Email client and device reporting Read time tracking Engagement scoring Accessibility checks Spam filter testing | Custom pricing only, demo call required (see here) | No |
Email marketing reporting tools
The right email marketing reporting tools transform raw campaign data into strategic insights. Advanced email reporting platforms offer native CRM integration, custom dashboard creation, and cross-channel attribution capabilities, but each tool brings its own strengths, depending on your needs.
Here are six platforms with strong email reporting capabilities:
1. HubSpot (Marketing Hub)
Best for: B2B teams that need email reporting connected to sales pipeline and revenue attribution in one platform.
HubSpot’s Marketing Hub provides comprehensive email reporting dashboards, A/B testing analytics, and contact-level engagement tracking — all connected directly to your CRM.
HubSpot’s key email marketing reporting features:
- Native CRM integration ties every email interaction to contact records, deals, and revenue
- Multi-touch attribution reporting (that shows how email influences the pipeline at each funnel stage)
- Custom dashboard builder with drag-and-drop widgets
- List health monitoring (tracking growth, churn, and segment performance over time)
HubSpot pricing (Marketing Hub):
- Starter: $9/month
- Professional: $800/month
- Enterprise: $3,600/month
2. Klaviyo
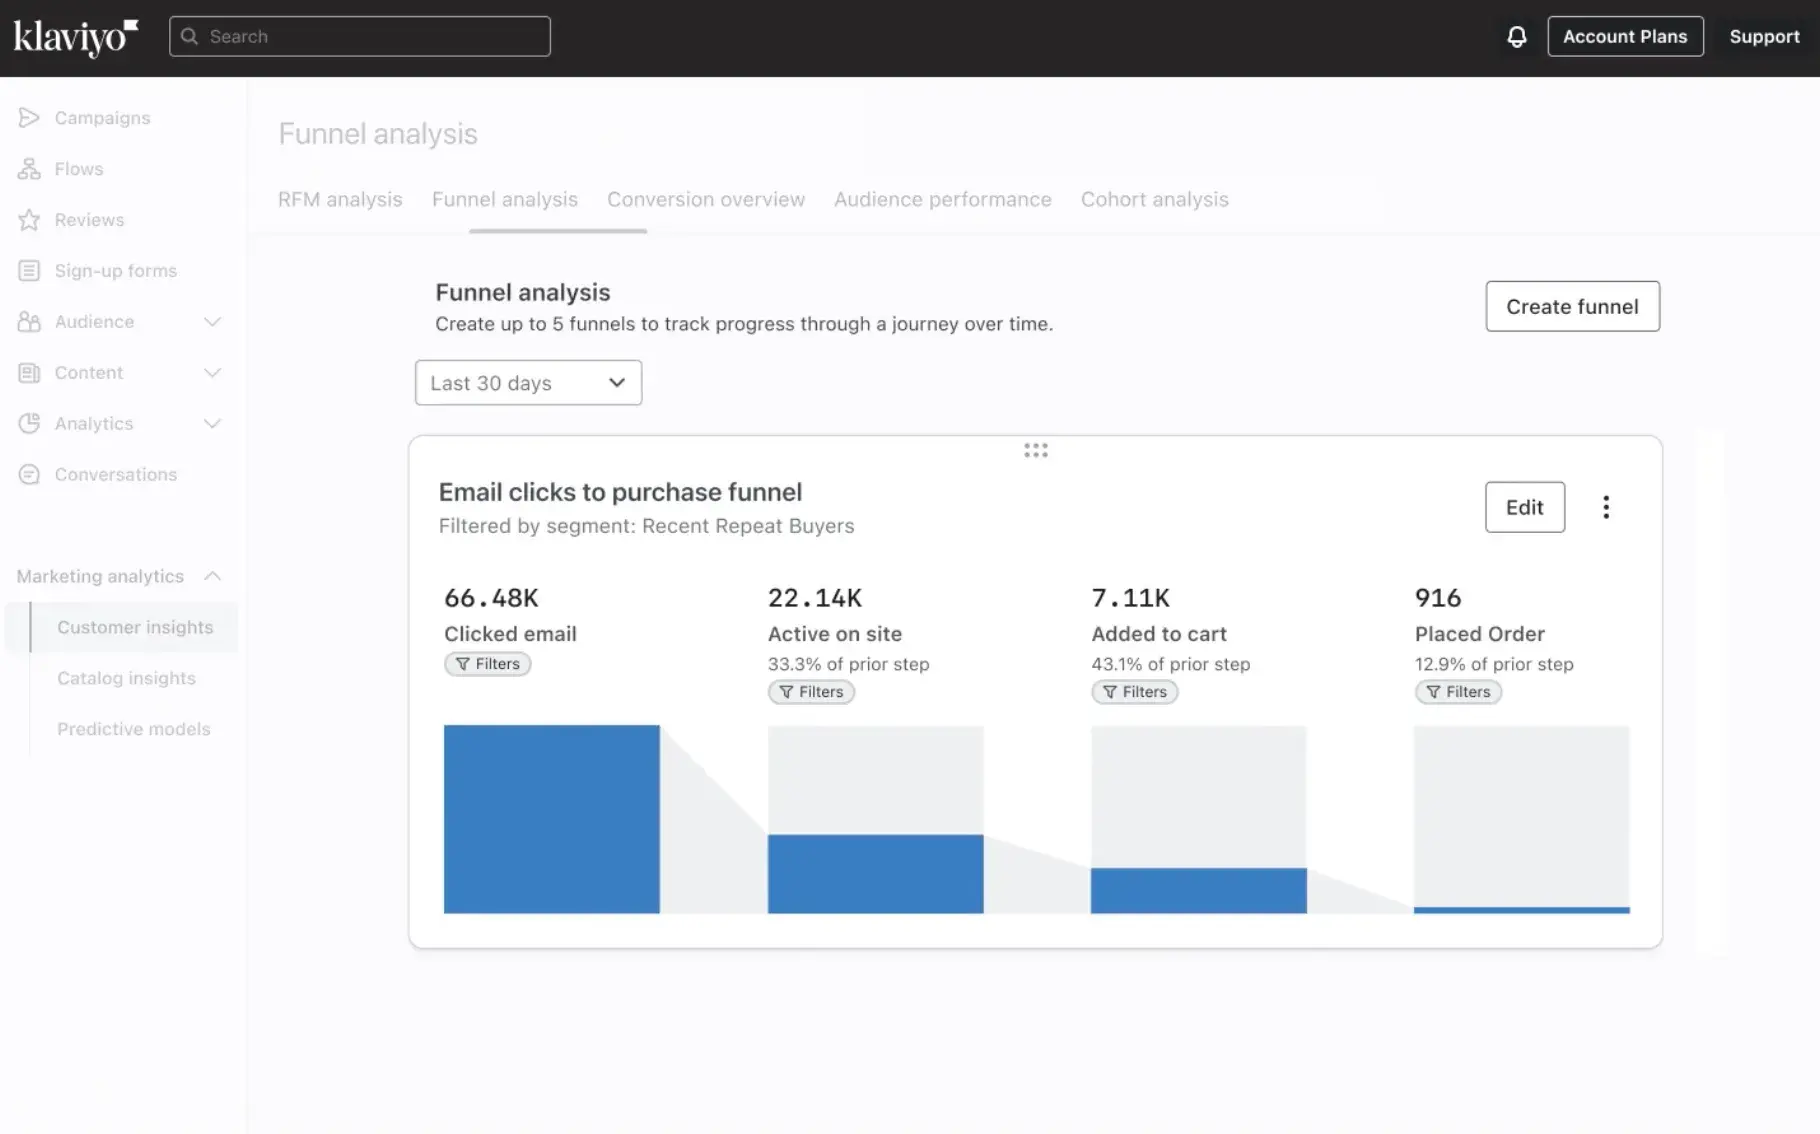
Best for: E-commerce brands that need direct revenue attribution tied to product catalog data.
Klaviyo specializes in e-commerce email reporting with deep integrations into Shopify, WooCommerce, and other online storefronts.
Klaviyo’s key email marketing reporting features:
- Revenue-per-recipient tracking
- Predictive analytics (including customer lifetime value and churn risk scores)
- Segment performance comparison showing engagement by customer cohort
- Product-level attribution (i.e., identifying which emails drive specific SKU purchases)
- Benchmark data
- Free: $0/month
- Email (1,001 to 1,500 profiles): $45/month
- Email (1,501 to 2,500 profiles): $65/month
*Note: Pricing for Klaviyo is based on the number of active profiles.
3. Mailchimp
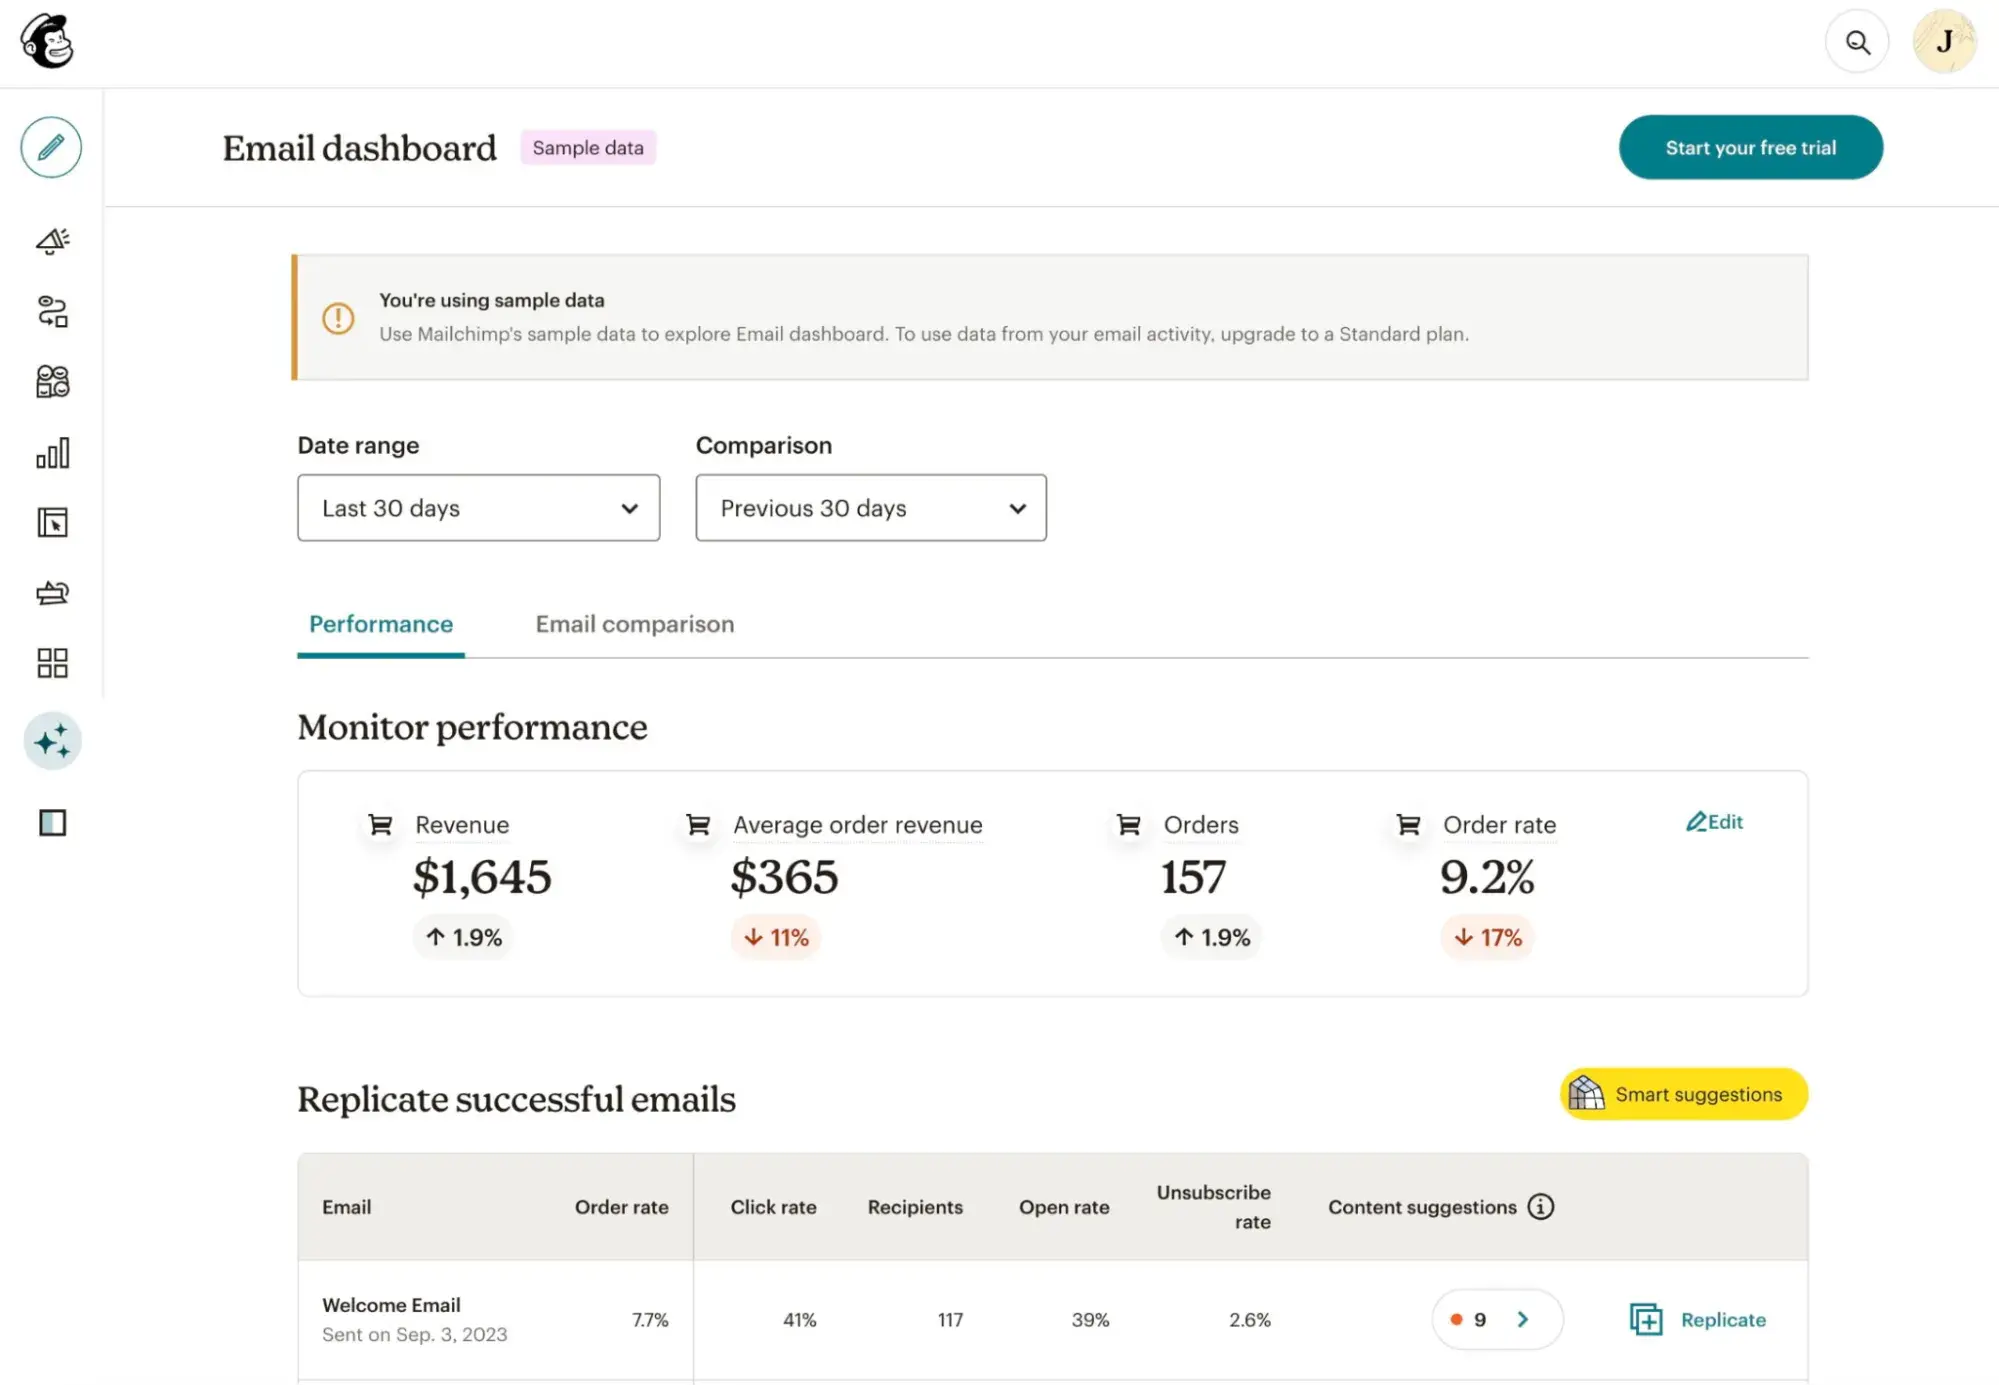
Best for: Small to mid-sized businesses seeking user-friendly email reporting without a steep learning curve.
Mailchimp offers accessible email marketing reporting for small businesses and growing teams with straightforward dashboards and industry benchmarking.
Mailchimp’s email marketing reporting features:
- Campaign performance snapshots with open rate, CTR, and revenue tracking
- Comparative reporting across campaigns to identify trends
- Click maps and subscriber activity timelines
- Industry benchmark comparisons
- Content optimizer with AI-driven recommendations for subject lines and send times
Mailchimp pricing (0-500 contacts):
- Free: $0/month
- Essentials: $13/month
- Standard: $20/month
- Premium: $350/month
*Note: Pricing for Mailchimp is based on the number of contacts.
4. Salesforce Marketing Cloud
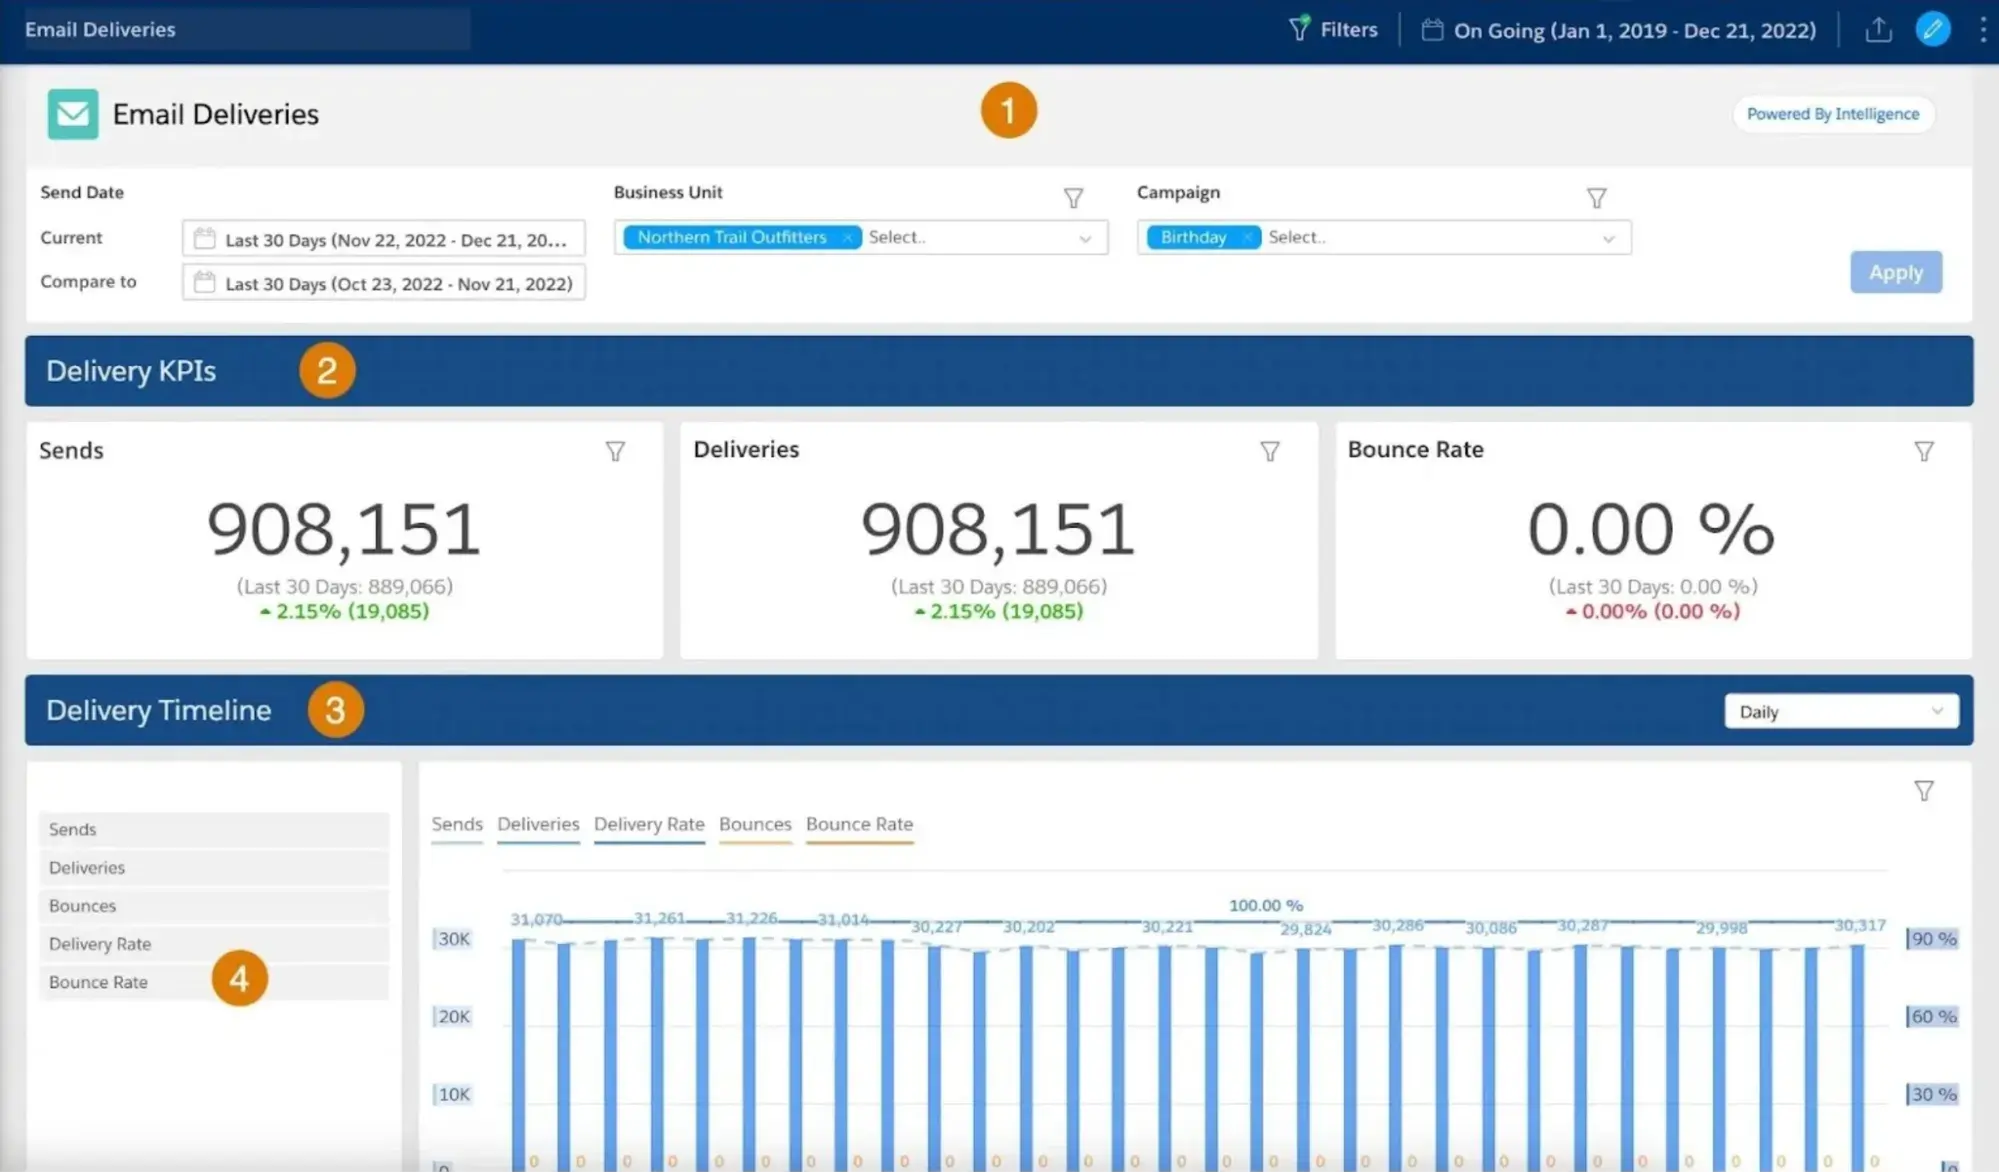
Best for: Enterprise organizations already invested in Salesforce who need email reporting unified with sales and service data.
Salesforce Marketing Cloud delivers enterprise-grade email reporting with deep integration into the Salesforce CRM ecosystem.
Salesforce Marketing Cloud key email marketing reporting features:
- Cross-channel journey reporting (connecting email to SMS, push, and advertising touchpoints)
- Custom report builder with SQL query access for advanced analysis
- Deliverability monitoring
- Account-based reporting
Salesforce Marketing Cloud pricing:
- Salesforce Starter: $25/month
- Marketing Cloud Growth Edition: $1,500/month
- Marketing Cloud Advanced Edition: $3,250/month
5. ActiveCampaign
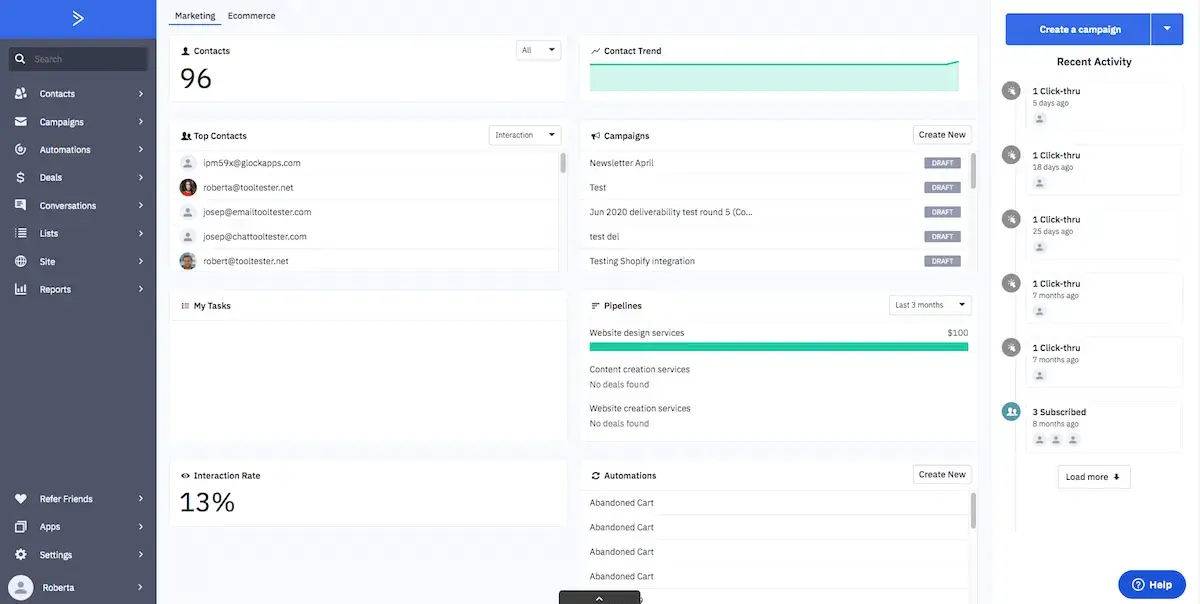
Best for: Teams running sophisticated automation workflows who need visibility into sequence-level performance.
ActiveCampaign combines email reporting with automation performance tracking, showing how individual emails perform within complex sequences.
ActiveCampaign’s key email reporting features:
- Automation funnel reporting
- Site tracking integration connecting email clicks to on-site behavior
- Deal attribution
- Split testing reports for subject lines, content, and automation paths
- Engagement tagging
ActiveCampaign pricing (email features only):
- Starter: $15/month
- Plus: $49/month
- Pro: $79/month
- Enterprise: $145/month
6. Litmus
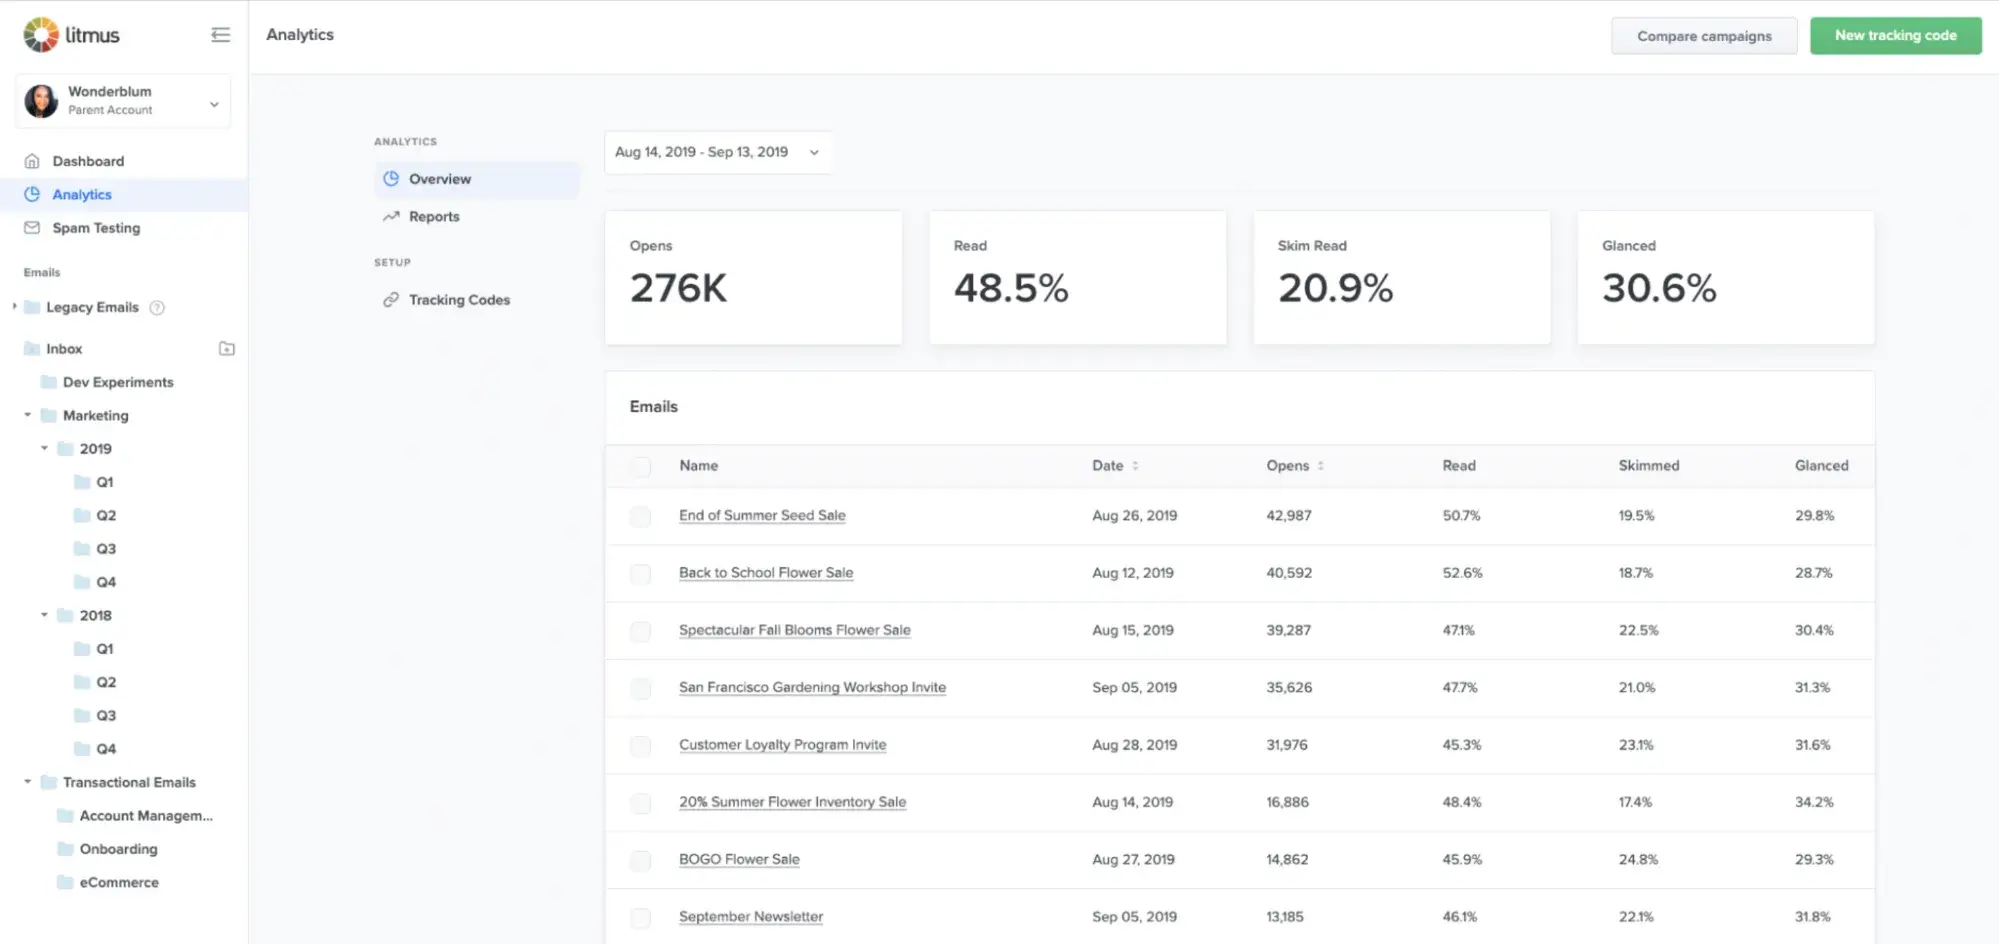
Best for: Teams prioritizing email design optimization, accessibility compliance, and deep engagement quality analysis.
Litmus focuses on email analytics with an emphasis on rendering, accessibility, and engagement quality metrics beyond opens and clicks.
Litmus’ key email reporting features:
- Email client and device reporting
- Read time tracking
- Engagement scoring (that categorizes subscribers as readers, skimmers, or deleters)
- Accessibility checking
- Spam filter testing
- Custom pricing only, demo call required (see here)
Frequently asked questions (FAQ) about email marketing reporting
Which benchmarks should I trust when I’m in a niche market?
Industry-wide benchmarks often miss the mark for niche markets due to limited sample sizes and audience variability. Your most reliable email marketing reporting benchmarks are internal.
However, I suggest building your own baseline by:
- Tracking your rolling 90-day average for each core metric (open rate, CTR, conversion rate, unsubscribe rate)
- Segmenting benchmarks by campaign type — promotional emails, newsletters, and transactional sends perform differently
- Documenting seasonal patterns specific to your audience
- Comparing performance across audience segments rather than against external data
Also, use third-party benchmarks directionally, not prescriptively. If your niche consistently sees 15% open rates while industry reports suggest 25%, your internal trend data matters more than the gap.
How can I quickly QA a sudden drop in open or click rates?
You probably guessed this, but I’ll say it anyway: A sudden performance drop signals a specific issue.
To work through it, use this diagnostic checklist:
Deliverability problems:
- Did your bounce rate spike? Check for list quality issues or a bad data import
- Did spam complaints increase? Review recent content for potential triggers
- Has your sending domain or IP reputation changed? Use tools like Google Postmaster to verify
Audience or segmentation issues:
- Did you send to a new or different segment than usual?
- Was the list recently cleaned, removing engaged contacts?
- Did you accidentally include a suppression list or exclude your most active subscribers?
Content or technical errors:
- Did the subject line contain spam-trigger words or broken personalization tokens?
- Were links broken, causing clicks to go untracked?
- Did images fail to load, reducing engagement cues?
External factors:
- Did a major event (holiday, news cycle) shift audience attention?
- Did Apple MPP or email client updates affect tracking accuracy?
The top reporting features in email marketing software — regardless of which platform you’re using — should include real-time alerts when metrics fall outside normal ranges. However, if you’re using HubSpot, its Reporting and Dashboard Software lets you compare the underperforming send against recent campaigns side by side, helping you isolate the variable that changed.
Email marketing reporting ain’t so bad after all
Your data-driven email strategy is within reach; you just have to start measuring what matters.
Although email marketing has grown more complex, the fundamentals of strong reporting remain unchanged. That said, every successful email marketing reporting framework needs:
- Clear KPIs tied to business outcomes
- Consistent tracking and analysis
- Genuine connection between engagement and revenue
The right email marketing reporting tools reveal whether your investment in campaigns translates into pipeline growth, conversions, and customer lifetime value — not just vanity metrics.
As I’ve already mentioned (time and time again throughout this post), email marketing reporting requires tracking deliverability metrics, engagement rates, and revenue attribution. When you build this foundation correctly, every send becomes an opportunity to learn, optimize, and prove impact.
HubSpot’s Marketing Hub supports your email reporting strategy by:
- Connecting performance to revenue through unified dashboards that tie opens and clicks to closed deals and pipeline value
- Segmenting engagement data dynamically (so you can analyze performance by audience behavior, lifecycle stage, and campaign type)
- Integrating with your CRM to centralize email metrics alongside contact records, sales activity, and attribution data
Whether you’re sending weekly newsletters or automated nurture sequences, your emails deserve reporting that captures their true business impact.
Ready to build email reporting that proves ROI? Get started with HubSpot’s Email Marketing Software to create professional campaigns, track the metrics that matter, and connect every send to revenue — all from one platform.