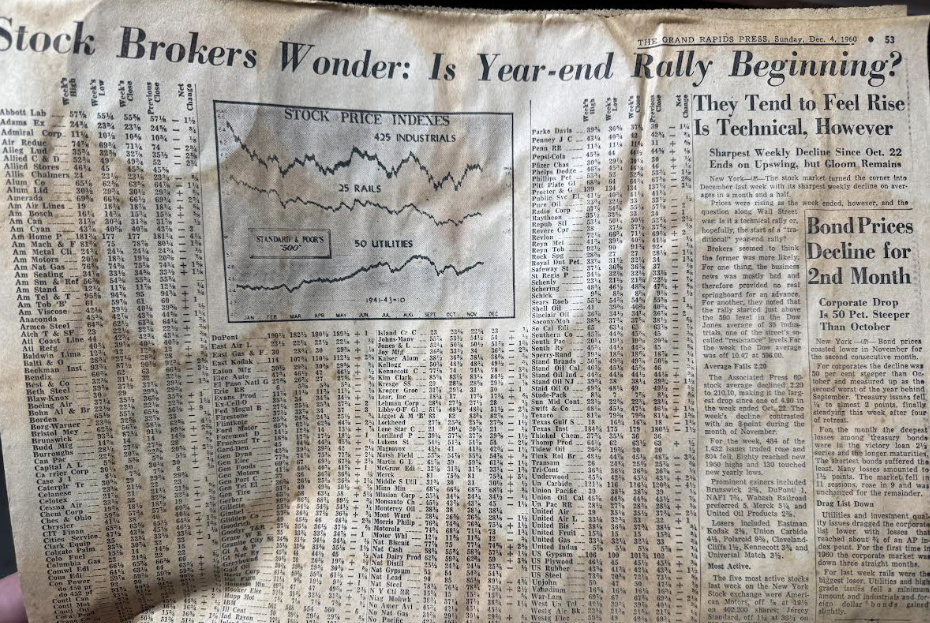

A friend was cleaning out one of his rental properties and came across the business section in an old newspaper from 1960:
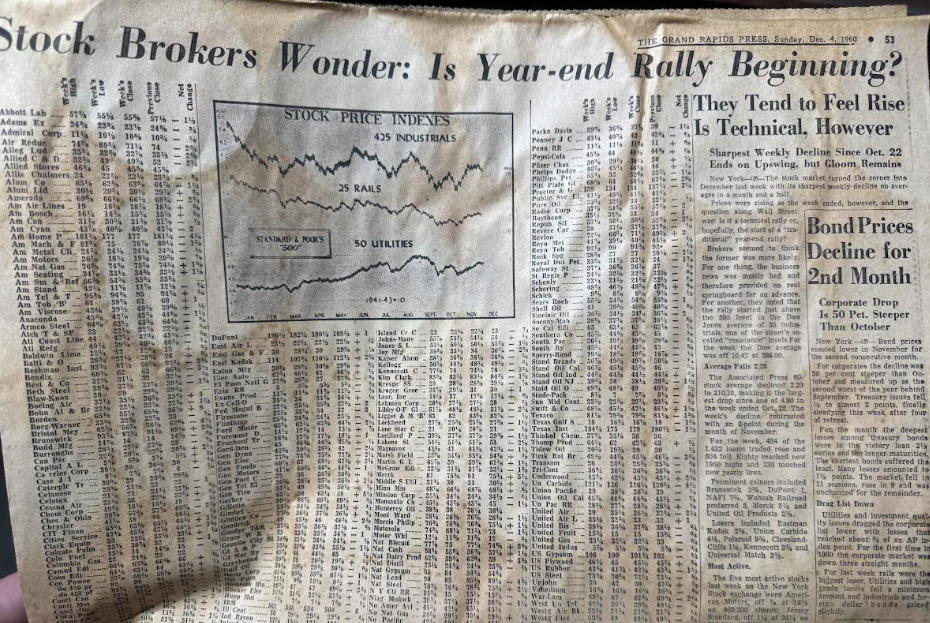
The chart shows the make-up of the S&P 500 by sector at the time:
- 425 industrials
- 25 rail companies
- 50 utilities
Things look just a tad different today.
This is what the S&P 500 company breakdown looks like now:
- Industrials 83
- Financials 76
- Information Technology 75
- Health Care 60
- Consumer Discretionary 47
- Consumer Staples 34
- Utilities 31
- Real Estate 30
- Materials 24
- Energy 21
- Communication Services 22
Yes the stock market is more concentrated in the top names now, but there is far more diversification in the types of companies that make-up the index.1
This is also one of the reasons it’s so difficult to compare historical valuations to today’s markets. The companies and sector make-up of the index are completely different.
Jason Zweig wrote a piece this week that explores how market structure has changed over time as well:
Trading was exorbitantly expensive. For an individual buying (or selling) shares in small lots, brokerage costs regularly hit 2% or even more. Even for institutions, brokerage costs could exceed 1%.
Funds cost a fortune. For most investors, mutual funds were the only practical way to own a diversified portfolio–but sales loads, or commissions, typically ranged between 5% and 8% up front, plus an annual management fee of 0.5% to 2%.
The playing field was tilted. Until the Securities and Exchange Commission imposed Regulation FD in 2000, companies could disclose material information to certain people without revealing it to everyone at the same time.
Taxes took a huge toll. Investment researcher Andrew Ang recently estimated that federal taxes would have chopped down the 10%-plus long-term annualized return on stocks in the chart to 7%. To be sure, tax rates are much lower now than in past decades–but Ang’s numbers exclude state and local income taxes, and future tax rates might well rise again.
Spreads were a component of return. Until 1997, stocks traded in price increments of 1/8th, or a “spread” of 12.5 cents. Picture a small-cap stock that closed at its bid price of $1. If a buyer came along the next day and paid the ask price of $1.125, then bang! Just like that, a 12.5% return! Today, when stocks trade in increments of one penny or less, such “bid-ask bounces” are immaterial.
It used to be so much more costly to transact in the markets. Vanguard’s first index fund had a sales load of 8.5%!

Maybe stock market returns will be lower going forward on a gross basis than they were in the past. But on a net, after cost basis, investors have never had it better than today.
Reg FD is probably the most important change to the market structure this century that no one ever talks about. Once regulators required any significant corporate information be made available to all investors at once, it made it much harder for hedge fund managers and other large active investors to win using proprietary information.
There’s a reason there haven’t been nearly as many legendary investors beating the markets lately. The playing field has been leveled.
It’s also true that the low fruit has been picked in many ways because market knowledge and data are so much more ubiquitous today.
In his wonderful new book, A Fabulous Debt, Robin Wigglesworth spends a chapter explaining how Michael Milken essentially created the high yield bond market in the 1970s.
In college, Milken came across an old book by Walter Braddock Hickman that shared an exhaustive study on the performance of corporate bonds between 1900 and 1943. Based on the performance numbers, the book concluded the following:
- Investors paid lower prices and demanded higher yields for lower quality bonds.
- Default rates on these bonds were higher.
- Higher yields more than made up for the higher default rates.
In essence, taking more risk led to higher returns.
This seems rather obvious today but it wasn’t at the time. Wigglesworth explains:
As one of Milken’s future colleagues at Drexel puts it, “Maybe 2,000 people read Hickman’s book, and 1,999 ignored it.” In contrast, Milken, the sole outlier, devoured the jargon-filled text, the dense footnotes, the charts of bond yields, and all the tables that showed the individual defaults of companies over the study’s four decades.
Intrigued by Hickman’s findings — which ran completely contrary to what his professors were teaching him — Milken threw himself into studying the fixed income market’s history.
Milken would go on to more or less control the junk bond market in the 1980s. It didn’t end well for him but it’s incredible to think about how little people knew about the fixed income markets back then.
A lot has changed in the markets over the years.
There are more products and strategies than ever before.
Costs are lower.
Automated investing has made it easier to stay on track.
Human nature is the one constant across all market cycles.
In a world with so much more information, market knowledge, data and analysis you have to fight against overconfidence about the future.
Knowing more about what happened in the past and having more data about the present doesn’t make it any easier to predict the future.
Michael and I talked about the evolution of markets and more on this week’s Animal Spirits video:
Subscribe to The Compound so you never miss an episode.
Further Reading:
The Automatic Investing Revolution
Now here’s what I’ve been reading lately:
Books:
1It’s interesting to note there are actually more industrial stocks than tech stocks but tech stocks are so much bigger in terms of market share.