
One of the hard parts about using history as a playbook in the markets is we don’t have a huge sample size.
In the past 100 years or so, there have really only been three secular bear markets and three secular bull markets.
Since WWII, there have been just six drawdowns of 30% or worse for the U.S. stock market. You had the bull market of the 1950s, the 1980s and 1990s run and now the 2010s into the 2020s.
Market history can help you understand risk and a range of outcomes, but it’s difficult to predict the future based on the past. This is especially true when it comes to tops and bottoms.
Plenty of investors are trying to model how the current market cycle will end. Predicting the future is hard so it’s easy to rely on the past for comparison purposes. The two most recent market-clearing events were both memorable.
When the dot-com bubble burst in 2000, the S&P 500 fell 50%. The Nasdaq 100 was obliterated, crashing more than 80%.
There seem to be a lot of similarities between the Internet buildout and the AI capex binge so a lot of people like this analogy.
The Great Financial Crisis is even more top of mind because it was the last true financial calamity that caused a huge panic. The U.S. stock market declined by nearly 60%. The financial system almost went under. It was also the last credit cycle.
An AI bust could cause a dot-com-like crash or financial crisis. It’s such a big part of the stock market and economic story right now that you can’t rule out a nasty ending to this cycle.
Allow me to offer another historical analogy for how this situation could end, assuming things go bad at some point (which they invariably do).
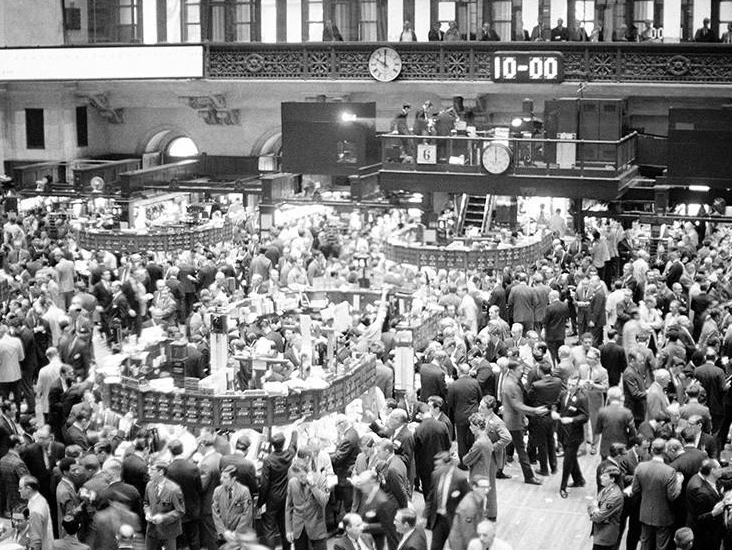
The Go-Go Years of the 1960s were defined by speculation, growing adoption of investment products by retail investors, rapid technological progress and a belief that the traditional rules of investing no longer applied.
It was also an environment defined by name-brand growth stocks people invested in because they used their products or services. Companies like Coca-Cola, Polaroid, Avon, McDonald’s, Disney, Anheuser-Busch, JC Penney, Kodak, etc.
The Nifty Fifty were one-decision stocks (buy them), much like the Mag 7 stocks have become over the past decade or so.
The interesting outcome at the end of the Go-Go Years is how much worse the crash was in the most beloved stocks versus the rest of the stock market and the economy.

The was a minor recession from the end of 1969 that lasted through most of 1970 but GDP fell just 0.6%. The stock market had a textbook recessionary bear market, falling 36% from peak-to-trough.
But the growth stocks every mutual fund manager and retail trader invested in got obliterated.
John Brooks wrote about this in his book The Go-Go Years:
A financial consultant named Max Shapiro, writing in the January 1971 issue of Dun’s Review, tried to construct a new yardstick more appropriate to the new situation. As a rough modern counterpart to what the Dow represented in the old days, Shapiro made a list of thirty leading glamour stocks of the nineteen sixties — ten leading conglomerates including Litton, Gulf and Western, and Ling-Temco-Vaught, ten computer stocks including IBM, Leasco, and Sperry Rand, and ten technology stocks including Polaroid, Xerox, and Fairchild Camera. The average 1969-1970 decline of the ten conglomerates, Shapiro found, had been 86 percent; of the computer stocks, 80 percent; of the technology stocks, 77 percent. The average decline of all thirty stocks in this handmade neo-Dow had been 81 percent. Even allowing for the fact that the advantage of hindsight gave Shapiro the opportunity to choose for inclusion in his list particular stocks that would help prove his point, his analysis strongly suggests that, as measured by the performance of the stocks in which the novice investor was most likely to make his first plunges, the 1969-1970 crash was fully comparable to that of 1929.
Comparing the end of the Go-Go Years to the Great Depression seems like a stretch.
But the point Brooks was trying to make is that there was so much more participation in the stock market in the 1960s than there was in the 1930s:
Measured by the number of people affected and the gross sums of money they lost, 1969-1970 was strikingly worse than 1929-1930. In 1929 there were, at the most, four or five million Americans who owned stock; in 1970, by the New York Stock Exchange’s own proud count, there were about 31 million. As to the sums of money lost, between September and November 1929 around $30 billion eroded from paper value of stocks listed on the New York Stock Exchange, and a few billion more from that of stocks traded elsewhere; the 1969-1970 loss, including issues listed on the two leading exchanges and those traded over-the-counter, totaled in excess of $300 billion, ten times the former amount.
There are more retail investors taking part in the stock market today than ever before.
The dollar losses from current levels will obviously be much larger because portfolios are so much bigger from the bull market. That can increase the pain level for those who haven’t experienced a true bear market in some time.
It also makes sense to me that the biggest high-flyers will experience outsized losses. Pain underneath the surface could look much worse than the losses for the overall market.
Tech stocks have lapped the field this cycle. The returns have been far more muted in other areas of the market.
Could we see a massive tech unwind while the rest of the market has a relatively normal bear market whenever this cycle ends?
Will retail investors who have taken on more and more risk experience bigger losses than the overall stock market?
Will this bull market ever come to an end?
I ask questions like this not only because it’s difficult to forecast the future. I also find it helpful to prepare for a wide range of potential outcomes even though the future never looks exactly like the past.
Further Reading:
Why the Stock Market Has to Crash